Most teams cannot answer a simple question: “Is our product data good?” They have spreadsheets full of attribute counts, screenshots of empty fields, and a vague sense that things could be tidier. None of that is a measure. Product data quality is measurable, and the buyers who get the most out of their PIM treat it that way. This piece sets out six dimensions you can score, what a passing benchmark looks like for each, and how to turn the score into a quarterly audit your team will actually run.
Why “good” is undefined in most catalogues
Walk into any catalogue review with a distributor or retailer, and the conversation goes the same way. The merchandising lead says completeness is at 78%. The ecommerce manager says the product detail pages still look thin. The supplier team says everyone is enriching what they can. Three teams, three accounts of the same data, but no shared definition of what ‘good’ means.
We see this pattern across every PIM project, and it is the single biggest reason data work stalls. Without a definition of quality, you can’t prioritise, show progress, or justify investment. The catalogue stays in a state that everyone agrees isn’t good enough and which nobody is sure how to fix.
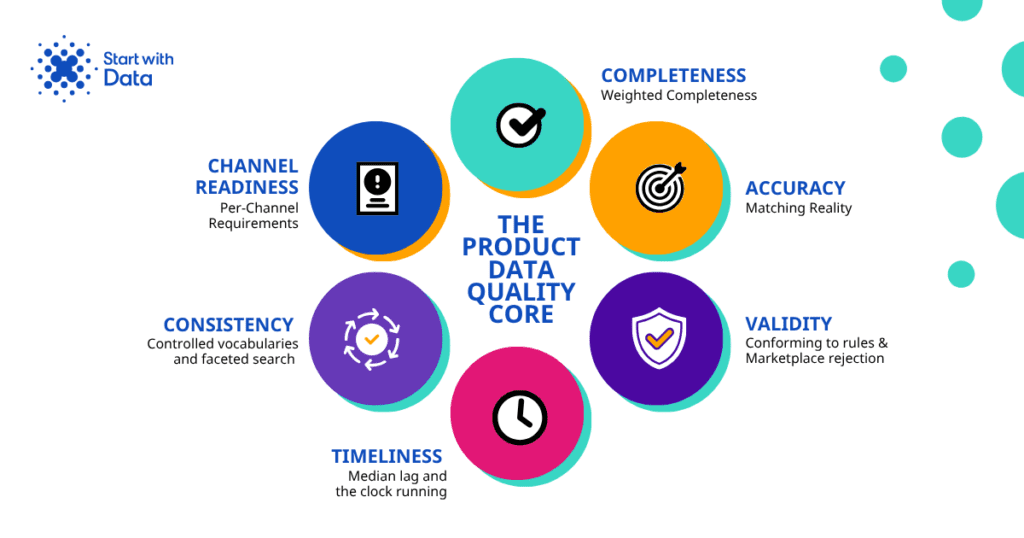
Product data quality isn’t a feeling. Neither is it an educated guess. It’s a measurable property of your catalogue, broken into dimensions that score independently. The six that matter for commercial product data are:
- Accuracy
- Consistency
- Timeliness
- Validity
- Channel Readiness
Each one tells you something different. Each one needs a different fix. And each one has a defensible benchmark that varies by industry and channel mix.
This is the work that sits underneath every meaningful catalogue improvement programme. Our product data services team has run audits across distributors, retailers, and manufacturers over the past five years, and the pattern is the same every time. The teams that score systematically catch up faster than the teams that work on intuition. By a considerable margin.
The six dimensions of product data quality
1. Completeness
Completeness measures whether every required attribute has a value, for every product, in every channel where that product is sold. It is the easiest dimension to measure and the one most teams over-report.
The trap is counting fields, not weighted fields. If your schema has 80 attributes and 60 are populated, you have 75% completeness on paper. But ten of those 80 drive 80% of search filtering, marketplace acceptance, and PDP conversion. If those ten are half-populated, your real completeness against business-critical attributes might be 50%, not 75%.
We score completeness in two layers. Field-level completeness is the raw count: what percentage of attributes have a value, across the full schema. Weighted completeness multiplies each attribute by its business value, so a missing colour on a fashion item costs more than a missing manufacturer’s part number on the same record. The gap between the two numbers tells you whether your team is filling fields or filling the right fields.
A passing benchmark for weighted completeness sits at 95% for ecommerce-ready catalogues. Below 90% and your PDPs visibly suffer. Below 80% and you are losing search filtering, marketplace listings, and cross-sell. We have looked at the launch-impact angle separately in why missing attributes are slowing your product launches.
2. Accuracy
Accuracy is whether the value in the field matches reality. A product with weight 2.4 kg in your PIM and 4.8 kg on the manufacturer’s spec sheet has a completeness score of 100% and an accuracy score of zero.
This dimension is the hardest to measure because it requires external reference data. You cannot audit accuracy from inside the PIM alone. You need either:
- The manufacturer’s authoritative spec
- A sample of physical product checks
- Or a structured comparison against a trusted third-party data source
In practice, accuracy gets sampled. We pull a stratified sample of 200 to 500 SKUs across categories, source the manufacturer truth for each, and compare ten to fifteen critical attributes. The result is a confidence interval, not a single number. A passing benchmark is 97% accuracy on critical attributes (dimensions, weight, materials, compliance markings, part numbers). If below 95%, your returns rate starts climbing.
Errors in accuracy compound. A wrong weight breaks shipping. A wrong material breaks filters. A wrong part number breaks parts-to-vehicle matching. Catch it once and the fix is cheap. Catch it after six months downstream and the cleanup is significant.
3. Consistency
Consistency measures whether the same fact is expressed the same way across records. Two products with the same colour should both say “navy”, not “navy” and “dark blue” and “Navy Blue”. Two products with the same material should not be “stainless steel” on one record and “SS304” on another.
This is the dimension most affected by supplier sprawl. Every supplier brings their own vocabulary. Without taxonomy enforcement, the catalogue ends up with seven ways of saying the same thing, and search filters break.
We measure consistency by attribute-distinct-value count against a controlled vocabulary. If your material field has 312 distinct values across 40,000 products in a furniture catalogue, the field is not consistent. A clean version has 30 to 50 distinct values in a managed taxonomy. The ratio of actual to expected values is the consistency score for that attribute.
A passing benchmark is 90% consistency against the controlled vocabulary, measured across the top 20 filterable attributes. Below that and your faceted search starts feeling random to customers. We have written separately about why your ecommerce filters do not work, and inconsistency is the root cause in most cases.
4. Timeliness
Timeliness is the gap between a product change happening in the real world and that change being reflected in your catalogue. Whether it’s new product launches, price changes, spec revisions, or discontinuations, the clock is always running for these areas.
Most teams don’t measure this. They feel it. The new product was supposed to launch on Monday, but the data wasn’t ready until Thursday. The supplier discontinued a SKU three months ago and it’s still displayed on the site.
To measure timeliness, define a set of event types (new product, price change, spec update, discontinuation) and track median and 95th percentile lag from event to publish. For a distributor running 50,000 SKUs across multiple suppliers, a healthy median lag for new product onboarding is two to three weeks. Above six weeks and you are losing launch revenue.
Timeliness is where supplier onboarding workflow shows up in the score. Our experience is that the median lag for new product data is the single best leading indicator of catalogue health. It captures all the following in one number:
- Supplier discipline
- Internal review capacity
- PIM workflow efficiency
5. Validity
Validity is whether the data conforms to the rules of its field. A weight field with the value “approx 2 kg” fails validation. A colour field with “see image” fails validation. An ISBN field with 12 digits fails validation.
This is the dimension that bridges product data and system integration. PIMs, marketplaces, and ERP systems all enforce field-level rules:
- Data type
- Format
- Length
- Allowed values
Records that pass completeness but fail validity get rejected when they hit the marketplace, and your team finds out three days later when the sales report shows that the listing never went live.
We score validity by running each attribute against its declared rules. Format rules (regex for SKU codes, length for descriptions), data type rules (numbers in numeric fields), and allowed-value rules (controlled vocabularies). The output is a validity score per attribute, then a record-level validity score that is the percentage of attributes passing every rule.
A passing benchmark is 99% validity on records destined for external channels. Marketplaces are unforgiving. Amazon, eBay, Mirakl, and B2B marketplaces all reject feeds that contain validity errors, and the rejected products don’t generate revenue until they’re fixed.
6. Channel readiness
Channel readiness asks whether a record meets the specific requirements of the channel it is destined for. A product can be complete, accurate, consistent, timely, and valid against your internal schema, and still fail when it lands in a channel that asks for something extra.
Amazon requires bullet point descriptions in a specific format. Google Shopping needs GTIN and brand and a particular set of category mappings. A trade marketplace might require parts-to-vehicle mapping, ETIM classification, or sector-specific compliance attributes. Your retailer customers might require their own internal SKU code on every record.
Channel readiness is therefore not just one score, but one score per channel. We define channel readiness as the percentage of records that meet 100% of the channel’s published requirements. For a distributor selling across its website, two trade marketplaces, and a B2B portal, that means four readiness scores.
A passing benchmark for ecommerce-ready channels (your own website, Google Shopping) sits at 95%. For controlled marketplaces (Amazon, eBay), 98%. For B2B sector marketplaces with strict classification (ETIM, eCl@ss), 99%. The numbers look high because the cost of a rejected listing in those channels is high.
How to score each dimension
The six dimensions need to roll up into something a board can read. We use a 0 to 100 score per dimension, with the dimension scores rolled into a weighted composite. The weighting depends on the business model.
For a pure ecommerce retailer, channel readiness and completeness carry the heaviest weight. For an industrial distributor running parts catalogues across multiple suppliers, accuracy and consistency dominate. For a manufacturer feeding distributors and marketplaces, validity and timeliness lead.
The scoring methodology has three steps. Define what is in scope for each dimension, run the measurement, normalise to a 0 to 100 score. The trap is in step one: completeness measured against 200 attributes is not the same number as completeness measured against the 25 critical attributes. Be explicit about the scope and keep it stable between audits so trends are meaningful.
Output the result as a scorecard, one row per dimension, with current score, target, and movement since the last audit. Senior buyers do not want a 30-page report. They want one page and the trend.
Sample scorecard
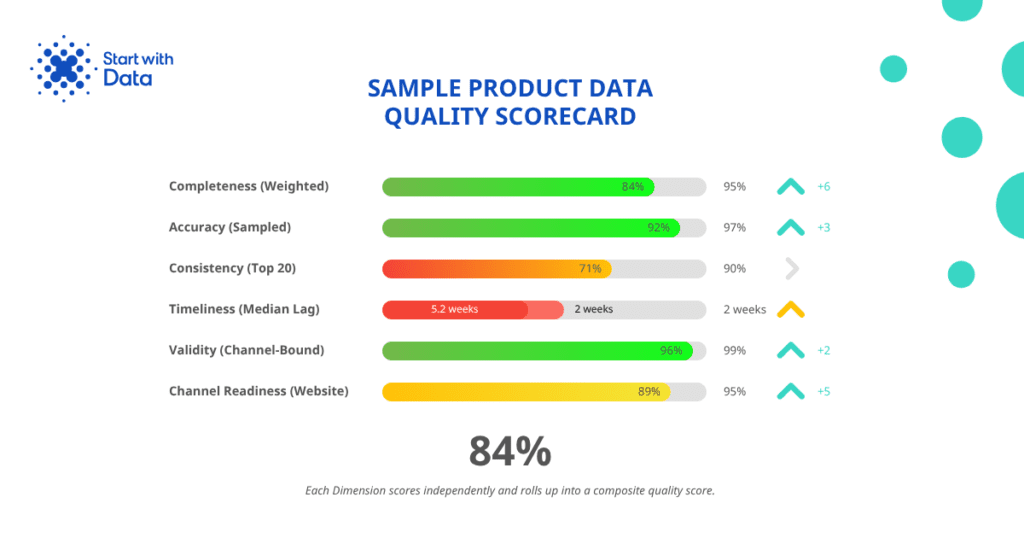
Here is what a real distributor scorecard looks like, taken from an audit we ran for a mid-market industrial distributor (anonymised) with 60,000 SKUs across 80 suppliers.
| Dimension | Current score | Target | Movement |
| Completeness (weighted) | 84% | 95% | +6 points in twelve months |
| Accuracy (sampled) | 92% | 97% | +3 points |
| Consistency (top 20 attributes) | 71% | 90% | Flat |
| Timeliness (new product median lag) | 5.2 weeks | 2 weeks | Improving slowly |
| Validity (channel-bound records) | 96% | 99% | +2 points |
| Channel readiness (website) | 89% | 95% | +5 points |
| Channel readiness (Amazon Business) | 78% | 98% | Newly added channel |
The composite score is 84%. The pattern is typical: completeness and accuracy are progressing; consistency and timeliness are stuck because they need investment in taxonomy and supplier workflow rather than enrichment effort.
A scorecard like this changes the conversation. Instead of “the catalogue is not great”, the executive sponsor sees that consistency is the bottleneck. That maps to specific actions:
- Taxonomy work
- Supplier vocabulary mapping
- Attribute normalisation
The fix becomes scoped, costable, and defensible.
Benchmarks by industry
Quality benchmarks aren’t universal. The same score means different things in different industries.
B2B distribution: (industrial, electrical, automotive parts). Expect weighted completeness above 90%, accuracy above 95% on critical attributes, and consistency above 85% against a managed taxonomy. Channel readiness for sector marketplaces and trade portals needs to clear 98% because compliance attributes drive listing acceptance.
Retail ecommerce:
Weighted completeness should clear 95% for live SKUs, accuracy above 97% on dimensions and materials, and channel readiness for the primary website above 95%. Consistency matters most on filterable attributes (size, colour, material, brand) because faceted search is a primary conversion driver.
Manufacturing:
The bar is lower on consistency (manufacturers control their own vocabulary) but higher on accuracy (specs are the product). Validity matters because manufacturers feed distributors and marketplaces, and a malformed record propagates downstream.
Automotive aftermarket:
Parts-to-vehicle accuracy is the dimension that dominates. Below 98% accuracy on fitment data and the returns rate breaks the business model. Our work with automotive parts distributors shows the same pattern repeatedly: get fitment accuracy right and the rest of the dimensions follow.
Building supplies:
The pattern is wider product ranges, longer supplier tails, and slower data flow. Realistic benchmarks are 88% completeness, 93% accuracy, 80% consistency, with the consistency gap driven by supplier vocabulary sprawl.
These numbers are starting points. The right benchmark for your catalogue depends on channel mix, supplier discipline, and category complexity. The point is to set one and measure against it.
How to run a quarterly audit
A quarterly cadence works for most catalogues. More often than that and the score does not move enough to be informative. Less often and the data ages out before you act on it.
The audit has six stages.
1. Scope freeze. Define the SKU set, the attribute set, and the channels in scope. Document this and reuse it next quarter so trends are comparable.
2. Pull the data. Export from the PIM, including attribute values, channel mappings, and last-updated timestamps. For accuracy, pull the sample list and request manufacturer references.
3. Run the measurements. Score each of the six dimensions against the methodology. Most of this can be automated once the scope is stable.
4. Sample and verify. Validate the automated scores against a manual check on 50 to 100 SKUs. This catches scoring bugs and surfaces attribute-level issues that the automation doesn’t flag.
5. Write the scorecard. One page. Current scores, target scores, movement, two or three priority actions for the next quarter.
6. Review with the sponsor. Not the catalogue team. The executive sponsor. The audit only changes behaviour if it shapes the next quarter’s investment decision.
The first audit takes meaningful effort because the scope and methodology are new. Subsequent audits get faster. By the third quarter, the cycle takes a week or two of focused work and produces a board-ready output. The teams who keep doing it treat catalogue health the way finance treats month-end close: a non-negotiable recurring exercise that produces the numbers everyone uses to make decisions. That shift in posture is what separates catalogues that improve from those that drift.
This work sits at the heart of our product data services practice. If your catalogue is heading into a PIM project, a marketplace expansion, or a channel migration without a baseline score, the project will run blind. We have also written about why your product data is not broken, it is unfinished, and the audit is what tells you which parts are unfinished.
Key takeaways
- Product data quality is measurable across six dimensions: completeness, accuracy, consistency, timeliness, validity, and channel readiness. Each needs its own score.
- Weighted completeness matters more than raw completeness. Ten critical attributes drive most of the commercial outcome.
- Accuracy needs external reference data and a sample-based approach. You cannot audit it from inside the PIM alone.
- Channel readiness is per-channel, not a single number. Score every channel separately.
- Benchmarks vary by industry. Industrial distribution and retail ecommerce have different passing scores on the same dimension.
- A quarterly audit is the discipline that turns scoring into action. Make it a recurring board-level review, not a side project.
Book a catalogue audit
If you want a structured score against the six dimensions, our catalogue audit produces one. Book a discovery call and we will scope an audit against your catalogue and channel mix.