Choose, implement and run the right PIM
Get product data complete and ready to sell
Tell us what is slowing your product data down and we will point you to the right service.
Insights
Guides, explainers and practical advice on product information management, product data enrichment and supplier data onboarding.
Insight
Product data governance is the set of owners, rules and routines that keep product data complete, correct and current. In practice every attribute has a named owner, every product passes agreed checks before it goes live, and someone reviews quality on a fixed rhythm. Without it, a new PIM decays within a year of go-live.
MRO distributor catalogues break because they combine hundreds of suppliers, very large numbers of technical SKUs and buyers who search by exact specification. When supplier data arrives in different structures, units and levels of completeness, filters fail, search misses and buyers pick up the phone or go elsewhere. The fix is rarely a new search tool. It is MRO product data built on a model.
ETIM is an open international classification standard for technical products. Each product is assigned to an ETIM class, and each class sets the features, units and value lists that describe it. Distributors use ETIM to receive supplier data in one structure, run consistent filters and exchange data with wholesalers and buying groups.
Agentic commerce is buying where an AI assistant researches, compares and in some cases completes a purchase for the shopper. An agent can only choose products it can understand. What decides the outcome is complete, structured, current product data: the same data behind your filters, site search and marketplace listings.
Bunnings supplier product data covers far more than a barcode and a price. Bunnings asks suppliers to provide and maintain master data, website content, images and compliance documents for every product they supply. New lines stall when that data is incomplete, does not match the physical product or arrives in the wrong structure. The fix sits upstream, in the supplier's own product data.
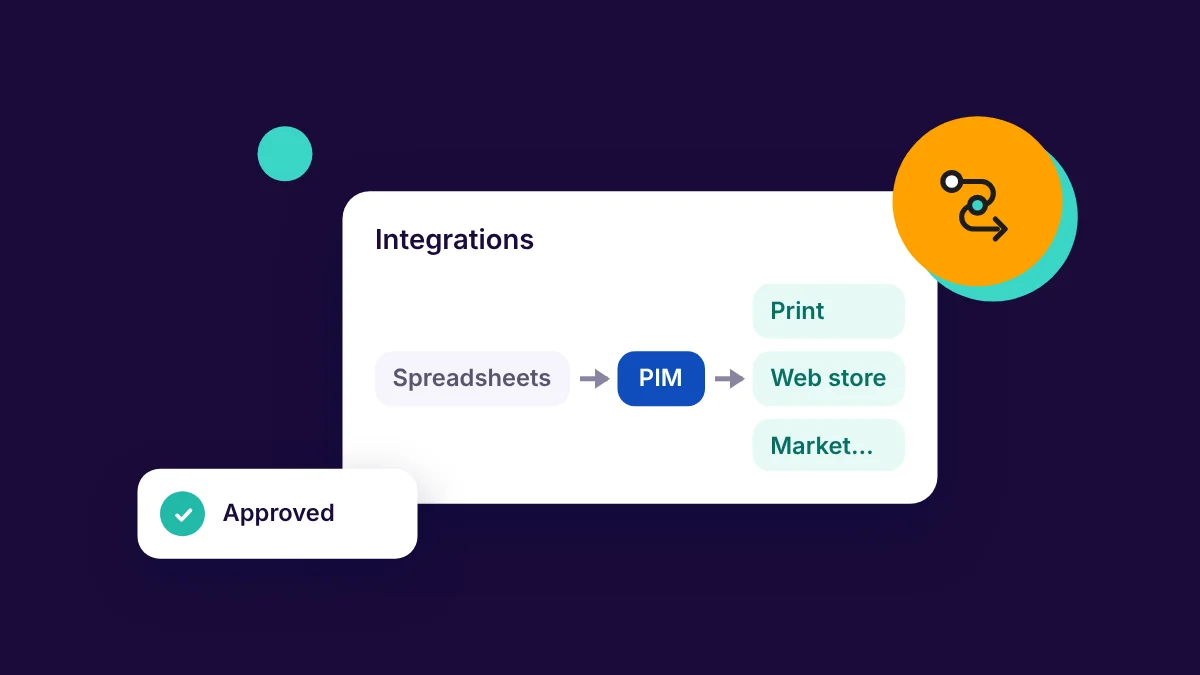
Maropost Commerce Cloud, formerly Neto, can hold product data well for a simple range. Once you sell thousands of SKUs from many suppliers, with variants, detailed attributes and several channels, that changes. A PIM becomes the governed source, and Maropost becomes one of the channels it feeds.
GS1 Australia issues the barcode numbers (GTINs) Australian suppliers use. It also runs the National Product Catalogue (NPC), the data pool suppliers use to share product, packaging and logistics data with retailers and healthcare buyers. Retailers such as Woolworths receive new item and pricing data through it, so getting it right decides how quickly a new line goes live.
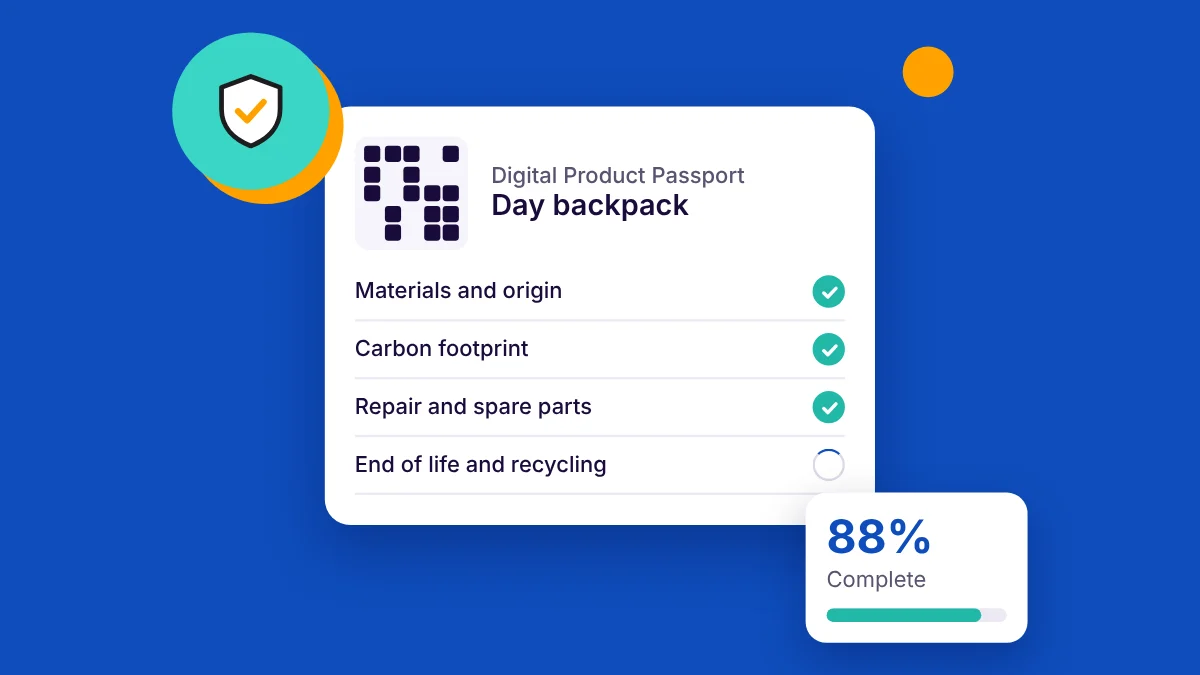
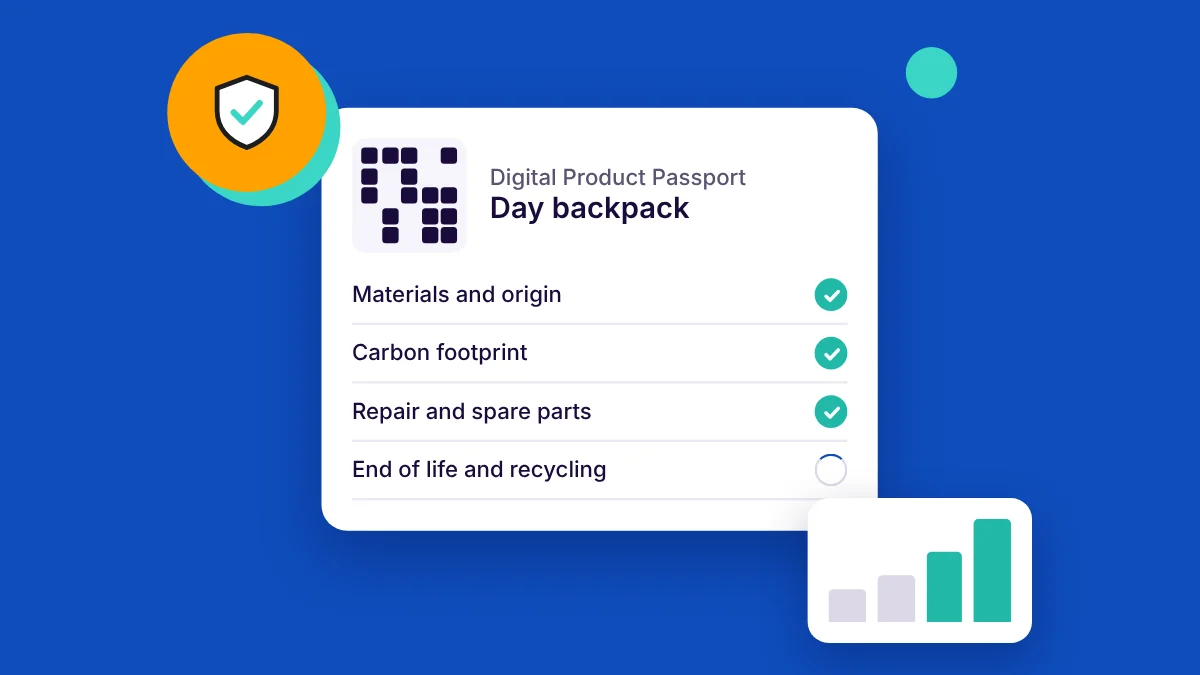
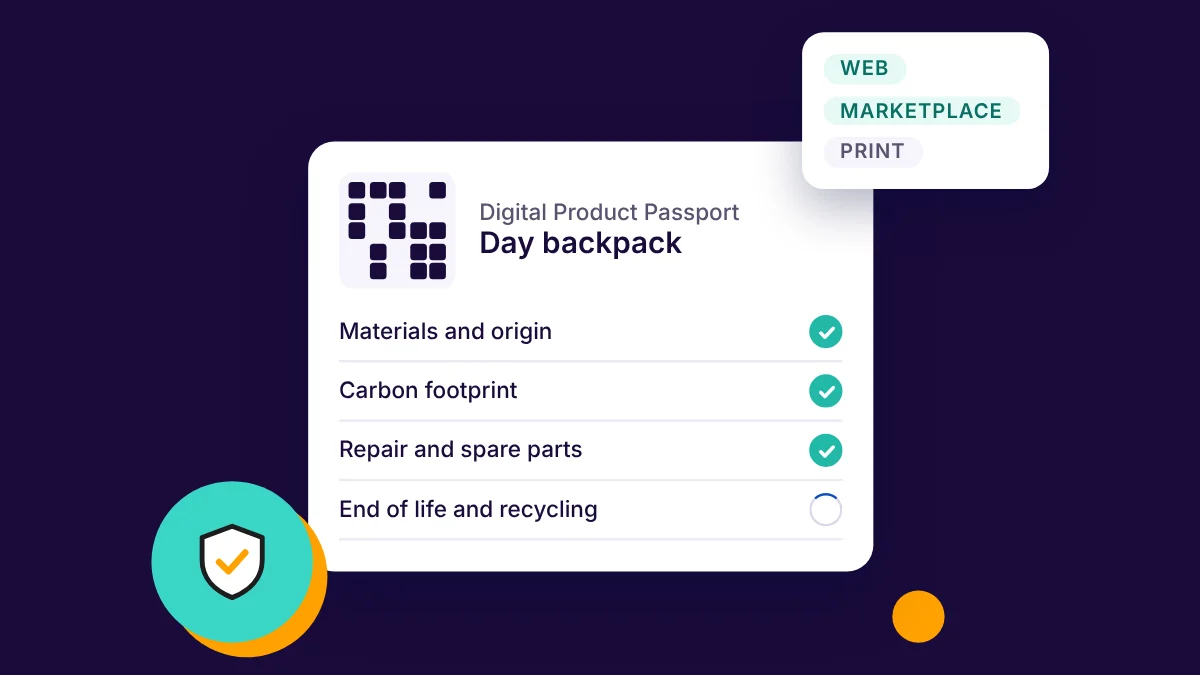
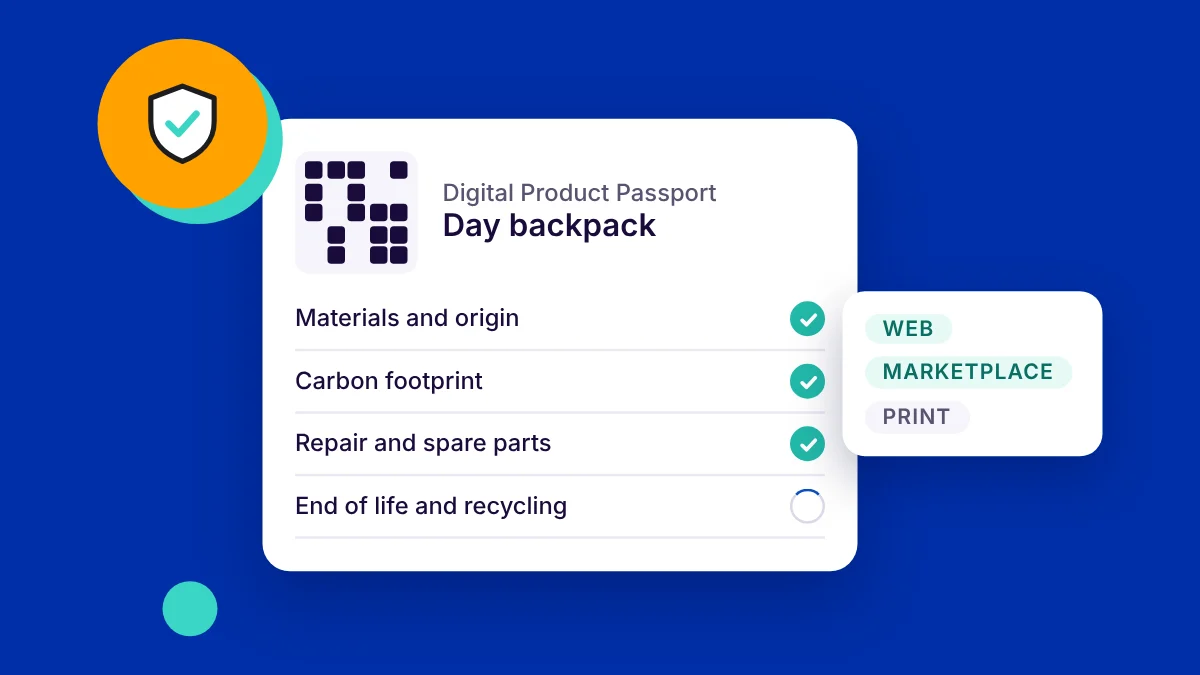
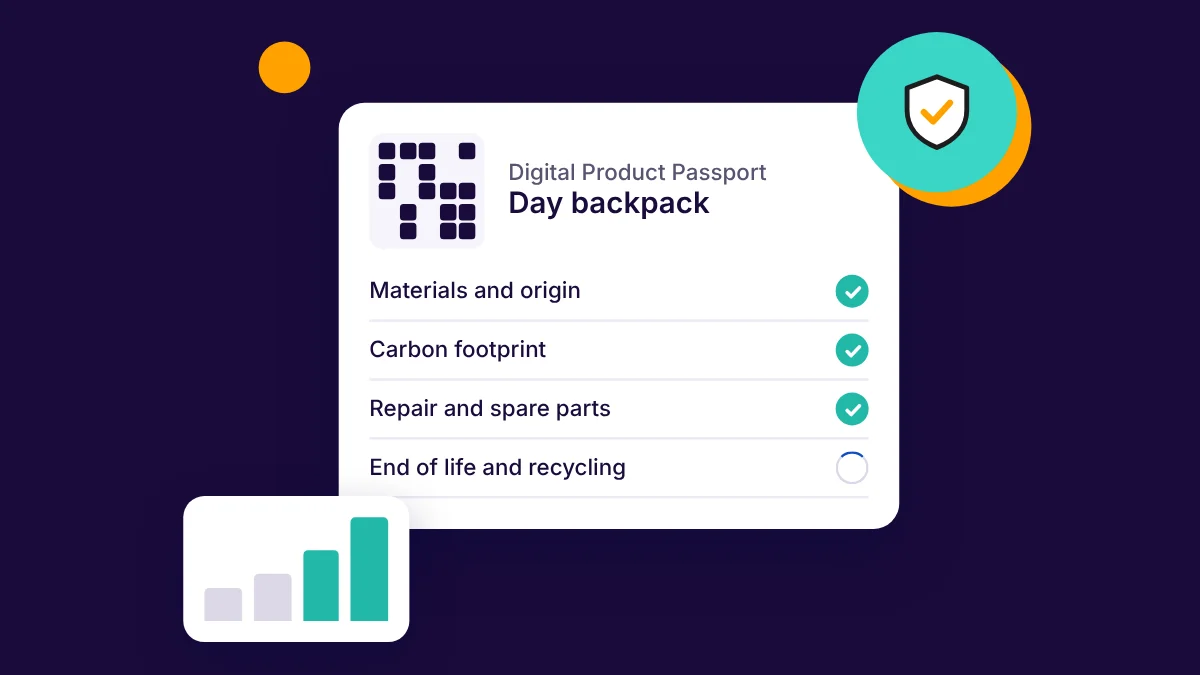
A Digital Product Passport (DPP) is a digital record of a product's composition, sustainability, repair and compliance information. People open it through a carrier such as a QR code. The EU is making it mandatory product group by product group, starting with batteries in February 2027. Most of the work is product data you already hold, collected from suppliers and governed in one place.
The licence is rarely the biggest number in a PIM budget, and it is the only one most vendors will quote you early. Everything else arrives later. Implementation, integration, getting the data fit to load, training, and the internal time nobody costed. PIM pricing conversations start with a monthly subscription and end somewhere considerably more expensive. This is the version we build with clients before they sign anything.
Three acronyms turn up in the same meeting and usually only one of them is relevant. PDM manages engineering definition: CAD files, drawings, revisions and bills of materials. PIM manages the commercial information you sell with: attributes, descriptions, images and channel-ready content. MDM governs the shared master records every system depends on, of which product is one domain. The phrase product data management causes most of the confusion, because it means the first one in engineering and the second one in ecommerce.
Most distributors do not have one product catalogue. They have five, and nobody owns the relationship between them. The ERP holds the list finance and the trade counter trust. The website holds a subset of it with better photography. A spreadsheet on somebody’s desktop holds whatever was last uploaded to a marketplace. Product catalogue management is the work of making those versions agree without maintaining each one by hand.
Search for Amazon listing optimisation and you will be sold copywriting. Better bullets, punchier titles, keyword-rich descriptions. We have rewritten plenty of Amazon copy over fifteen years and it does move numbers. It is also the second-order fix. In Amazon’s own published guidance, what decides whether a shopper ever sees your listing is the structured attribute data behind it. Amazon states the consequence of leaving those attributes empty in one unambiguous sentence.
A Google Shopping feed is not a marketing asset. It is a schema with a validator attached. Every disapproval traces back to an attribute that was empty, malformed, or contradicted by your own website. Google publishes the whole specification. Below is what it requires, which omission triggers which disapproval, and which of those a feed tool can fix. The rest have to be fixed in the PIM.
A marketplace listing rejected on submission is almost never a copywriting problem. It is an empty field, a value the channel does not recognise, or a category mapped to the wrong node. The causes are finite, they are published, and they are all fixable in your PIM before the feed leaves the building.
Search for supplier onboarding and almost everything you find is about procurement. Vendor risk, bank details, compliance questionnaires, master data in the ERP. All necessary, none of it the reason your new range is not on the website. The part that takes the time is product data. Getting a specification, a description, images and a hundred structured attributes out of a supplier, in a state you can sell from. That is a different process with different owners, and most distributors run it as a series of one-offs. Below is the supplier onboarding stage model we use to make it repeatable.
Your new line form is a spreadsheet. It has somewhere between forty and two hundred columns. There is a hidden tab nobody has opened since the person who built it left. The filename ends in v4_FINAL, and the version number stopped incrementing three years ago. A buyer emails it to a supplier. The supplier fills in what they can and guesses the rest. Someone in merchandising fixes it by hand. That loop is where speed to market goes, and it is the same loop in almost every distributor we work with.
A distributor sends us a category export. It has eight or nine hundred rows. We sort by product count and the bottom third of the tree holds fewer than five items per node. Somewhere near the middle there is a level that exists because the website menu needed a third click. Product taxonomy design is rarely a question of how deep the tree should go. It is a question of which decisions belong to categories and which belong to attributes. Depth is what you notice when that split has gone wrong.
Checked on 20 August 2026, the first line of Google’s published English taxonomy file still reads # Google_Product_Taxonomy_Version: 2021-09-21. That Google taxonomy lists 5,595 categories across 21 top-level branches, seven levels deep at its deepest point. The en-GB file carries the same version number. Google describes its own categorisation as “continuously evolving”. The gap between that and a static published file causes most of the mapping confusion we are asked to fix.
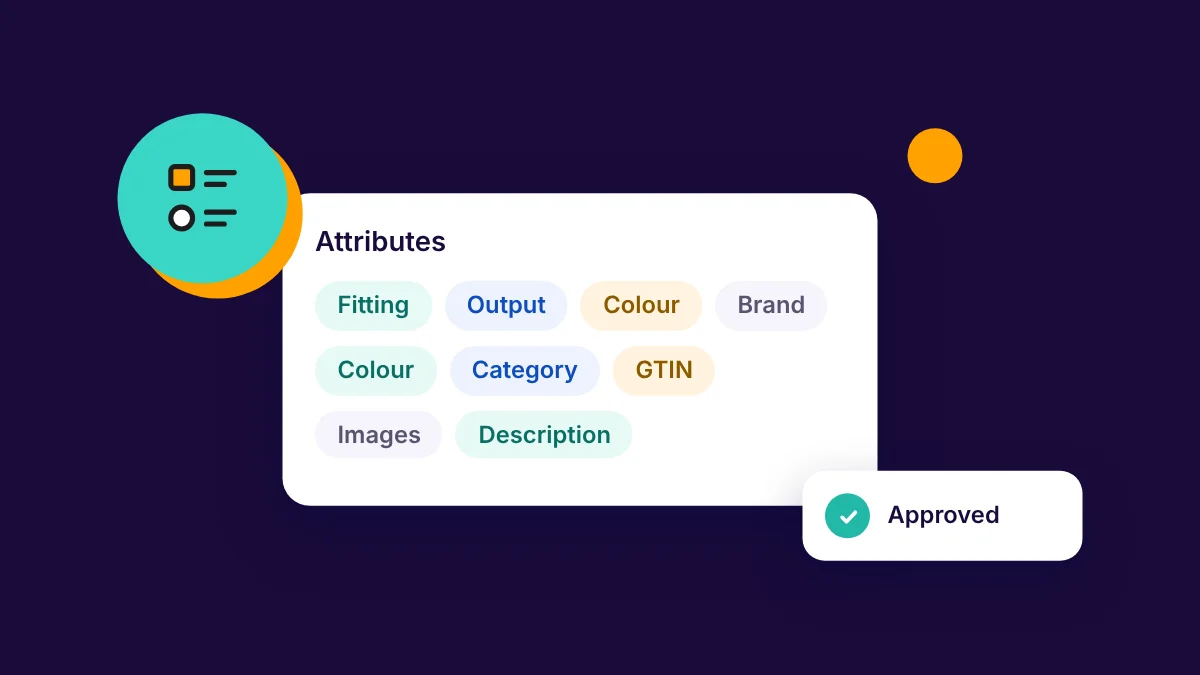
Most attribute models we inherit have between 1,200 and 4,000 product attributes, and fewer than 200 of them are doing any work. The rest are duplicates, supplier leftovers, free-text escape hatches and fields that were mandatory for a project that finished four years ago. Nobody deletes them, because nobody can prove they are unused. This is how a data model that was supposed to make products findable ends up making enrichment impossible. Here is how we define, scope, level and govern an attribute model that stays the size it should be.
Data quality assurance on a product catalogue is a rule library, not a dashboard. The dashboard is what you show the board. The rules are what stop a broken SKU reaching a channel. Most teams we meet have built the dashboard and never written the rules, so the number moves and nothing changes. This piece is the rule library. Four families of checks, how to write them, where to run them, and what to do when they fail.
A product data quality assessment should take three to six weeks and end with three things. A scored picture of one part of your catalogue. A named mechanism behind each failure. A costed, sequenced remediation plan you can take to a budget holder. If it ends with a dashboard and no plan, it was an expensive way to confirm what everyone already suspected. This is the method we run, written out in full so you can run it yourself.
Search for data quality dimensions and you get six words: completeness, uniqueness, timeliness, validity, accuracy, consistency. That list is real, it has a proper source, and it was written for customer and transaction records rather than for catalogues. Applied to a product record without translation it produces scores that look precise and change nothing. This page does the translation.
Product data enrichment is the work of turning a supplier’s raw record into something you can actually sell from. A part number, a trade price and forty words of manufacturer prose go in. A classified, attributed, described and illustrated product record comes out. That is the whole job. What varies enormously is how much of it a given catalogue needs, which is why nobody will quote you a price over the phone.
Most product data business cases die in the same meeting. They are written as a data project, so the finance director reads a cost with a vague benefit attached. The ones that get funded read as a change to three or four lines in the profit and loss. A measurement plan is bolted on. This article gives you that structure. The value lines that survive scrutiny, the ones that do not, the inputs to gather, and the eight objections you will get.
We sell outsourced enrichment, so treat what follows with the scepticism it deserves. We also turn work away roughly once a quarter. The honest answer to in-house vs outsourced data enrichment is that neither model wins outright. It depends on how specifiable your work is, how steady the volume is, and whether the knowledge involved is worth keeping inside the building. Here is the comparison we actually use when a Head of Product Data asks us which way to go.
Ask three suppliers for a product data enrichment cost and you will get three numbers that cannot be compared. One quotes per SKU. One quotes a day rate. One quotes a fixed price for a batch of ten thousand lines. None of them state what is inside the price, so the cheapest quote is usually the one with the smallest scope hidden in it. This article gives you the cost model instead of a headline rate, because the model is the thing you can budget against.
Most AI visibility tools give you a score out of a hundred and no way to act on it. The useful version of this exercise is different. You define a fixed panel of buying questions, run it across the assistants your buyers use, and record the whole answer each time. Then you read the citations rather than the score. This is the method we use, written out in full so you can run it yourself.
Ask an assistant which product to buy and it does not consult one ranked list. It rewrites your question into several queries. It pulls from a live search index and a merchant feed at once, then writes an answer from both. The products it names and the sources it links are chosen by two different mechanisms. Understanding how AI assistants choose products matters, because most catalogue owners are working on the wrong one.
Almost everything written about LLM optimisation is about blog posts. Write clearly, use headings, answer the question early. Fine advice, and useless if your problem is 400,000 SKUs where the torque rating lives in the middle of a paragraph. Product catalogues fail machine reading for structural reasons, not stylistic ones. This is what those reasons are, and what you change in the data model to fix them.
Ask an AI shopping assistant for a cordless impact driver under two hundred pounds with a brushless motor, and it will give you five products. Your competitor is in that list. You are not. Nothing is broken on your site. Nobody has penalised you. The assistant simply could not establish that your product met the conditions, so it moved on. Here are the six reasons that happens, and what each one looks like inside a real catalogue.
Most AI readiness assessments are workshops. Someone scores your organisation out of five on culture, skills and governance, then hands over a heat map. It tells you nothing about whether an assistant can answer a question about your products. This diagnostic does. It runs against your own catalogue. It takes five working days of one person’s time. It ends with a number you can put in front of a board.
Most articles about the digital product passport explain the policy. The policy is the easy part. A digital product passport is a structured data record. It ties to a product through an identifier and a data carrier. It holds fields you almost certainly do not have, at a level of identity your PIM was probably not built for. That is the part that costs money, and it is the part nobody prices.
From 18 February 2027, an electric vehicle battery cannot be placed on the EU market without a battery passport. The same goes for an e-bike battery, and for any industrial battery above 2 kWh. That date sits in Regulation (EU) 2023/1542, and the European Commission’s Digital Product Passport Registry has been live since 20 July 2026. This is the first digital product passport that will actually bite. For almost every distributor and manufacturer we speak to, it is a data problem long before it is a compliance problem.
ESPR is the Ecodesign for Sustainable Products Regulation, and it is the law that creates the Digital Product Passport. It entered into force on 18 July 2024 and it applies to almost every physical product sold in the EU. There are plenty of legal summaries of it. There are almost none that answer the question a product data team actually has: which attributes, at what granularity, held in which system. That is what this piece covers.
Most DPP readiness assessments are questionnaires. They ask whether you have a sustainability strategy, score you out of five, and produce a chart. That tells you nothing you can act on. The only useful test is run against your actual product records, field by field. It takes an afternoon. Below are the twelve checks we run on a client catalogue. Each one names the data it tests and what a fail looks like.
Most catalogues we open have four identifiers in one column. A GTIN is the GS1 number that identifies a trade item, and EAN and UPC are older names for two of its formats. An MPN is the manufacturer’s own part number. An ASIN belongs to Amazon and identifies a listing, not a product. Here is what each one is, who issues it, and where it belongs in your data model.
A supplier sends you a BMEcat file. It is 300MB of XML, half the descriptions are in German, and nobody can tell you whether it is version 1.2 or version 2005. BMEcat is the XML standard for exchanging product catalogues between suppliers, distributors and procurement systems, published by BME e.V. in Germany. If you buy from continental European manufacturers, you will meet it, and the English-language explanations of it are thin.
A GTIN identifies your product. It does not describe it. We watch suppliers discover that difference every year, usually the week a retail customer accepts the barcode and then rejects the listing. GS1 standards are excellent at the job they were built for. Selling the product is not that job.
A UNSPSC code tells a procurement system what kind of thing was bought. It tells a customer nothing at all about the product. That distinction is where most UNSPSC work quietly goes wrong. We map UNSPSC for distributors and manufacturers most years, usually alongside ETIM or a merchandising tree.
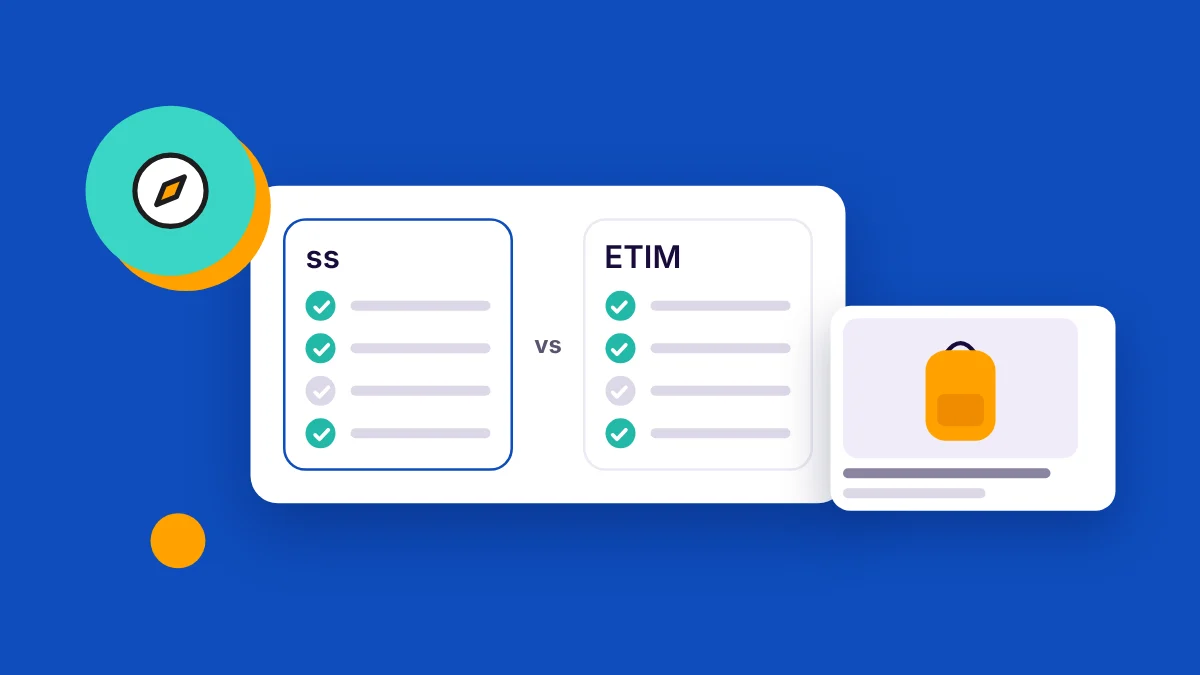
ECLASS, ETIM and UNSPSC get shortlisted against each other in the same meeting, and they should not be. They do three different jobs. ECLASS describes what a product is made of and how it performs, across every industry there is. ETIM does the same job in more depth for technical products in a narrower set of sectors. UNSPSC puts a code on a line of spend and stops there. When distributors ask us which one to adopt, the answer is usually two of them, for two different reasons.
ETIM 10.0 contains 5,640 product classes and 16,728 features. Neither of those numbers is the one that hurts. The one that hurts is 73,085, the count of class-feature relations in the model. A feature in ETIM carries no fixed unit and no fixed value list. Both are set per class. That single design decision is why ETIM mapping projects fall apart in month two. It is the first thing we walk through on every ETIM engagement.
Case Studies; Insight
AI in product data has a clean dividing line, and it is not the one most articles draw. The question is not whether a task is complex. It is whether the output can be checked against something.
Product classification is not filing. It is the structure that decides whether an engineer with a specification in mind finds your part in twenty seconds. Or buys it from someone else. In a catalogue of tens of thousands of SKUs, an inconsistent structure is not untidy. It is lost revenue that never appears in any report, because nobody measures the searches that returned nothing useful.
Clean product data pays back. What nobody can honestly tell you is by how much, in your business, without measuring it first. Every vendor case study you have been sent describes a different merchant, with a different catalogue, at a different starting point.
Do you need a PIM? For most businesses that put the question to us, the answer is yes, no, or not yet. It is rarely a close call once the right evidence is on the table. The difficulty is that almost everyone you can ask has a reason to say yes. Vendors sell platforms.
Industrial product data is not marketing collateral. It is the evidence an engineer uses to decide whether your part belongs in their design. And whether the plant is still running on Monday. Bearings, valves, and safety equipment are not bought on brand preference. They are selected on performance, compliance, and fit.
Product content performance is a different question from product data quality, and most teams only measure the second. Completeness scores tell you the attributes are populated. They tell you nothing about whether the content is doing any commercial work.
Product data sourcing sets the ceiling on everything downstream. No amount of cleaning, enrichment, or platform investment recovers information that was never obtained, and most catalogues are limited by acquisition rather than by processing.
A product description backlog is a prioritisation problem before it is a writing one. How to batch, set acceptance criteria, and stop it rebuilding.
Shopify product content usually fails in one specific way, and it is not the way merchants expect. The descriptions are fine. The photography is fine. What is missing is anything a customer can filter on, because the details sit inside prose rather than in structured fields.
Building materials product data has stopped being an administrative task and started deciding commercial outcomes. It determines whether a merchant will list your product and how long a new range takes to reach the trade counter. It also decides whether you clear the compliance bar on a tender.
Product content enrichment is the work of turning a record that exists into a record that sells. A product name, a code, and three specifications will get an item onto a website. They will not answer the questions a buyer asks before committing, and they will not satisfy a marketplace with forty mandatory attributes.
We have seen the same five failure modes across merchant and rural retail catalogues on both sides of the world.
We have run product data and PIM projects with companies including RS Group, APS Industrial, and Maxiparts, and across all of them we see the same seven patterns. Every single time.
The supplier onboarding process should be a repeatable workflow with templates, validation rules, and exception handling, not a one-off project run from scratch every time.
The question is no longer whether AI product descriptions are good enough to use commercially. They are. The question is which of three approaches fits the catalogue, the team, and the buyer.
ACES and PIES are the two XML data standards that underpin automotive aftermarket cataloguing.
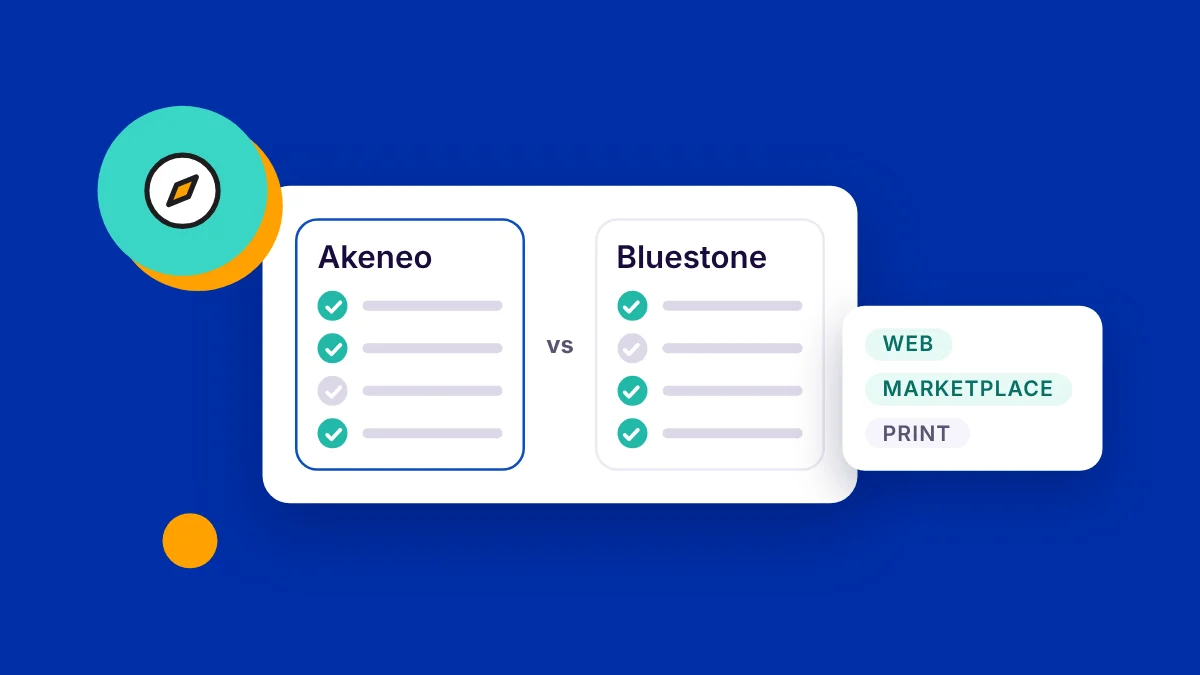
Most Akeneo vs Bluestone vs Plytix articles are written by people who have read the marketing pages, watched the demo videos, and assembled a feature comparison table from the vendor websites.
Most PIM vendor shortlists are built for retailers. The evaluation criteria assume a few thousand SKUs, consistent brand-owned product data, and a single primary ecommerce channel.
Insight; Resources
Shopify handles checkout, orders, and storefront design well. What it does not handle is complex product data at scale. Once your catalogue reaches a few thousand SKUs, or you start publishing to channels beyond your Shopify store, the standard product editor becomes a serious bottleneck.
Tell us what you are working on and we will point you to the right answer.